
At the Westway Sports Centre in North Kensington, 502 solar panels cover the roof. They aren’t owned by the centre, or by the council. They belong to a local co-operative, North Kensington Community Energy, which sells the electricity to the centre and puts the income back into the neighbourhood. That has included funding for a girls’ football team that plays in the very building the panels sit on.1
It’s a wonderful initiative. But under London’s grey skies, how do the sums stack up?
First, a word about size
Solar panels are sized in kilowatts peak, or kWp: the most electricity they can make in perfect sunshine. London won’t get perfect sunshine all year round, so the real output is lower. Two sources suggest that each kWp makes roughly 840 to 1,070 kilowatt-hours (kWh) of electricity a year in London. The higher figure is the central estimate used in government cost research for the whole UK;2 the lower comes from a design study for a partly shaded roof in Camden.3 One kilowatt-hour is what a 1,000-watt electric heater uses in an hour.
Three roofs, three price tags
(Figures are converted to Euros using €1.17/£4).
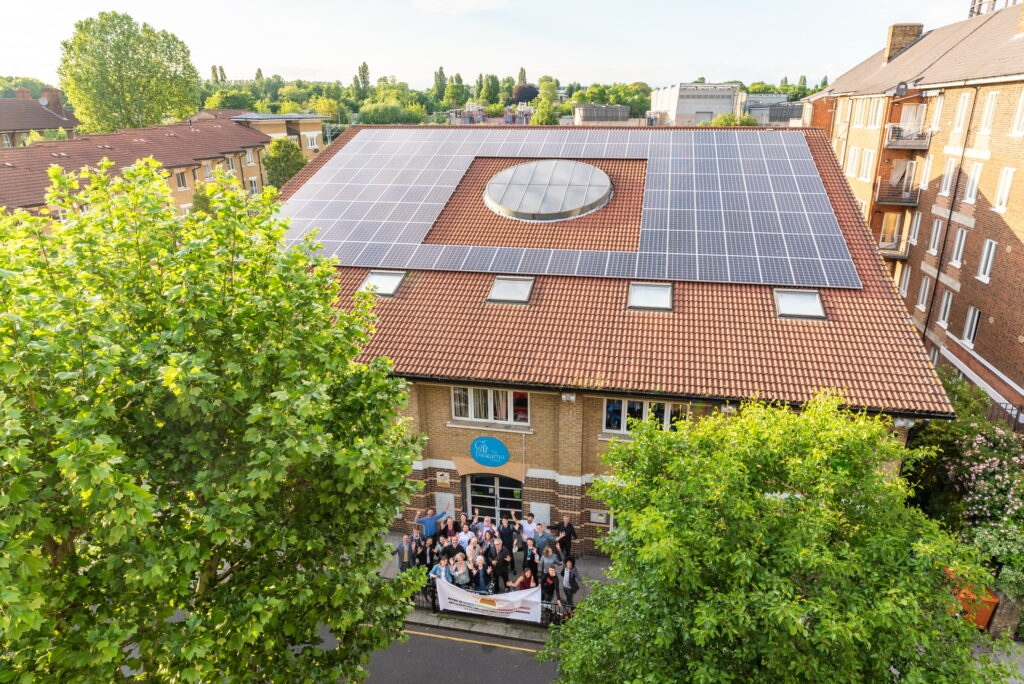
North Kensington, 2019; two schools and a community centre (pictured above). These panels give a maximum of 87 kW and should make an estimated 73,000 to 93,000 kWh a year. A community share offer raised £83,000 (€97,000), with extra support from the local council and the Mayor of London.5,6
Westway Sports Centre, 2020. This roof gives a maximum of 138 kW (about 116,000 to 148,000 kWh a year). A second share offer raised £107,000 (€125,000) from more than 100 investors, who are expected to get about 3% a year on their money.5 The centre saves about £1,000 (€1,170) a year on electricity, and the project is expected to give around £40,000 (€47,000) to a community fund over its lifetime.1
Housing Estate in Aldgate, City of London, 2022. These rooftop solar panels generate a peak 37 kW (roughly 31,000 to 40,000 kWh a year) and cost about £47,000 (€55,000) to install, helped by grants.7 Most of the electricity sold to the council for the estate’s shared areas.
So what does a unit of electricity cost?
We can calculated this by dividing the cost of each project by the electricity the panels should produce over 25 years, using the 840 to 1,070 kWh range above. This counts only the cost of buying and installing the panels, so it is a starting point rather than the full bill. The results:
- North Kensington schools and Dalgarno (community) Centre: about 3.6p to 4.5p per kWh (€0.04 to €0.05)
- Westway Sports Centre: about 2.9p to 3.7p per kWh (€0.03 to €0.04)
- Aldgate housing estate: about 4.8p to 6.1p per kWh (€0.06 to €0.07)
For comparison, the large solar farms in the latest government auction agreed to sell electricity at £65 per megawatt-hour, which is 6.5p (€0.08) per kWh, in 2024 prices.8 That price has to cover everything, including upkeep and profit, so it isn’t a like-for-like match with the sums above. But it shows that London’s community roofs sit in a similar range, even before running costs are added.
What the roof does, and doesn’t, do for the bills
Unfortunately rooftop solar installations aren’t creating a new ceiling on electricity costs, but are lowering bills. At Westway the saving is about £1,000 (€1,170) a year. Spread across the 116,000 to 148,000 kWh the panels should make, that is less than 1p (€0.01) a unit cheaper than grid electricity. The bigger gain is local: a community fund of around £40,000 (€47,000), a modest return for local investors, and a roof that earns money for the neighbourhood instead of for a distant company.
What to take with a pinch of salt
- Share money may not be the whole cost. The £83,000 and £107,000 were raised from investors, and grants helped too. The true cost of those two projects may have been higher, so my per-unit figures are probably on the low side.
- Only the panels are counted. Maintenance, insurance, replacing the inverter (the box that makes the electricity usable) and the 3% paid to investors are left out.
- Output is estimated, not measured. I couldn’t find published meter readings for any of these roofs.
- The prices are a few years old. They cover 2019 to 2022, and the newest roof, Burnt Oak, has no published cost.
- Most figures come from the developer. The savings and community fund estimates were published by Repowering London, which helped create these projects.
Why it matters now
In February 2026 the government published a Local Power Plan, designed to provide £1bn (€1.17bn) of funding for communities to own and control their own clean energy projects.8 If that money reaches more roofs like Westway’s, the real test will be whether the costs and community funds hold up, and whether the people who live nearby get to see the benefit.
Further, the UK government launched its ‘People’s Power Programme’, in which the recently-created Great British Energy offers £30 million (€35,925,000) for community-owned power.9
Sources
- Leisure centres and community energy: a match made in (net zero) heaven, Repowering London, 2026-08-26
- Onshore wind and solar PV cost of electricity report update 2024, Arup for the Department for Energy Security and Net Zero, 2025-07 (day not shown)
- York Way solar PV yield study, London Borough of Camden planning documents, undated
- British Pound (GBP) to Euro (EUR) Exchange Rate on 2026-07-27, ValutaFX, 2026-07-27
- North Kensington Community Energy, Repowering London, undated
- North Kensington Community Energy Project, Royal Borough of Kensington and Chelsea, undated
- Aldgate Solar Power, Repowering London, 2022-07-12
- Q&A: New UK onshore wind and solar is ‘50% cheaper’ than new gas, Carbon Brief, 2026-02-11
- ‘People’s Power’ projects to give more control over local energy, UK Government, 2026-09-17

